
Verta Experiment Manager enables data scientists to organize thousands of modeling experiments, visualize experimental data like metrics, hyperparameters, model quality, data samples, and share their work easily with colleagues.
We're excited to introduce new functionalities and an improved UI experience in the Experiment Manager module of the Verta platform.
Improvements include:
- A faster way to understand all of your experiment runs — with the ability to sort, filter and compare runs, as well as a customizable default view run table view so you can iterate faster
- Improved and easier-to-read experiment dashboards that now have:
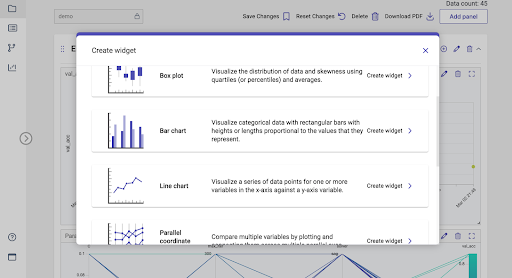
- A comprehensive library of charting widgets to customize your dashboard
- The ability to group similar charts and tables into panels for quick reading
- Markdown support to further customize your dashboards for stakeholders
- Easier dashboard debugging
Let’s take a look at some of these enhancements.
1. Build custom views with dashboards, panels and chart widgets
Dashboards help create a central place to organize and visualize results from your machine learning models. You can now group different experiment results into separate sections using panels.
With an expanded list of supported widgets, you can plot a variety of charts, create custom views for different teams, and share project status and results.
2. Create realtime and offline reports
Once you organize and embed visualizations and relevant charts, you can add a summary with our new markdown widget and convert your live dashboards into shareable reports for stakeholders. You can even download these reports as a pdf for offline sharing.
3. Sorting, filtering and comparing experiment runs
The updated experiment run table makes it easier to sort and filter hundreds or thousands of runs. You can easily show, hide, reorder, pin and unpin columns to customize the table view and surface key insights. Quickly register a model, deploy it, or leave a comment in the action column. The option to filter and take various actions like compare, register, deploy, and comment are now more accessible than ever.
The new run compare view makes it easier to compare multiple experiment runs using a tabular layout with the key differences being highlighted upfront. You can expand, collapse and drill down specific metrics of interest. Additionally, you can compare the runs visually with various charts.
Get started by logging experiment run details and various model performance metrics, hyperparameters, and other attributes in Verta using our client library. Learn more about how to log experiments with our quick start guide and an end-to-end example with a scikit-learn model.
Click here to schedule a demo.
Subscribe To Our Blog
Get the latest from Verta delivered directly to you email.