
Software engineers and SREs (Site Reliability Engineers) go to the APM tool of their choice to help gauge performance and flag problems like latency, throughput, and failures. On the other hand, ML engineers and data science teams lean on MLOps tools to deploy and monitor models.
ML models are not built in silos. They are typically embedded in products and business applications and tightly integrated with other production APIs and services. Verta bridges this gap with a new integration with Datadog — enabling users to get deep visibility into the operational health of their ML models with just a few simple steps.
The integration allows you to send operational and endpoint metrics from Verta to Datadog where you can monitor ML endpoint states, endpoint utilization, endpoint resources, as well as create dashboards, monitors and alerts.
This helps SREs and IT teams to manage all operational metrics and alerts in the APM system of their choice. A unified view enables consistency, easier correlation of metrics across all your applications, and faster incident troubleshooting.
How does it work?
Every model and component in the Verta system is instrumented to collect common operational and health metrics (e.g. throughput, latency) and call traces. This is done automatically for models without any extra effort from our users. Additionally, you have the option to customize your code and track custom metrics about model API calls.
Model health metrics are exposed in dashboards within the Verta system with out of box templates. If you have a Datadog setup, your Verta System Admins can easily connect the Datadog instance to the Verta platform and within minutes all your live endpoint metrics will start streaming to Datadog dashboards as custom metrics.
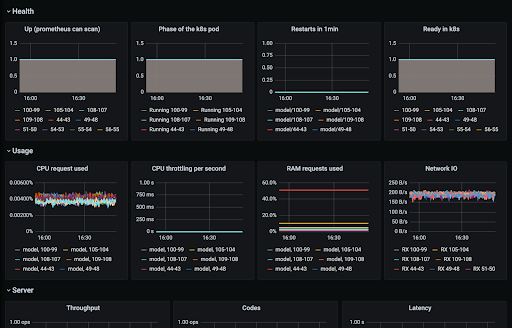
Default metrics for your Verta endpoint information are listed below, as well as an example of how they appear in Datadog:
- Health metrics like uptime, http requests, pod status etc.
- Resource utilization metrics like CPU usage, CPU throttling, CPU ratio, memory, RAM requests, Network I/O etc.
- Server metrics like throughput, latency, response codes
- Endpoint utilization metrics like api throughput and api latency
- Endpoint status to track new updates and releases and get alerted for any unexpected behavior
- Labels help you tag metrics based on endpoint path, model name and model version
Refer to our docs for details.
Ready to get started? Schedule a demo to talk to our experts.
Subscribe To Our Blog
Get the latest from Verta delivered directly to you email.